TRANSFORMATION
THROUGH REDUCTION
Backed by science, our climate strategy drives transformative change across our value chain. The proof is in the data and we account for all our environmental impacts, reducing them through measurable actions each and every day.
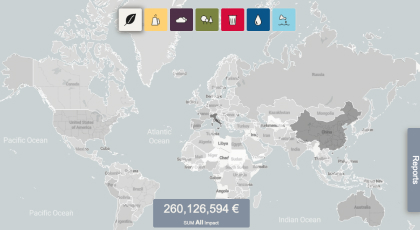
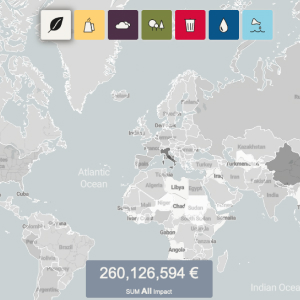
GUCCI’S 2022 EP&L RESULTS
To give us better insights on how and where we can reduce our environmental impacts, we’ve been measuring them through our Environmental Profit and Loss (EP&L) account every year. The EP&L analysis starts from raw material production deep in our supply chain all the way to product consumer use and end of life, capturing GHG emissions, water and air pollution, water consumption, waste, and land use. Following all our reduction efforts, the results of our 2022 EP&L are detailed in the table.
| Use phase & End of Life |
Tier 0 | Tier 1 | Tier 2 | Tier 3 | Tier 4 | ||
| 11% | 7% | 4% | 8% | 9% | 61% | ||
| Air emissions | 9% | ||||||
| GHGs | 41% | ||||||
| Land use | 30% | ||||||
| Waste | 4% | ||||||
|
Water consumption |
5% | ||||||
| Land use | 11% | ||||||
| Use phase & End of Life |
Tier 0 | Tier 1 | ||
| 11% | 7% | 4% | ||
| Air emissions | 9% | |||
| GHGs | 41% | |||
| Land use | 30% | |||
| Waste | 4% | |||
|
Water consumption |
5% | |||
| Land use | 11% | |||
| Tier 2 | Tier 3 | Tier 4 | ||
| 8% | 9% | 61% | ||
| Air emissions | 9% | |||
| GHGs | 41% | |||
| Land use | 30% | |||
| Waste | 4% | |||
|
Water consumption |
5% | |||
| Land use | 11% | |||
GHG emissions and land use are the most impactful environmental indicators, together representing 71% of Gucci’s EP&L total impact. Raw material production and processing in Tiers 3 and 4 account for 70% of Gucci’s value chain footprint.
IMPACT REDUCTIONS 2022 IN NUMBERS
Through our parent company Kering, we’ve set science-based climate targets and committed to reduce our greenhouse gas emissions in alignment with a 1.5°C pathway. We’re reducing our absolute greenhouse gas emissions in scopes 1 and 2 of the Greenhouse Gas Protocol by -90% and our scope 3 emissions by -70% per unit of value added by 2030, from a 2015 baseline. In 2022, we made good progress to reach these goals, achieving a -68% absolute reduction in scopes 1 and 2, with a -55% intensity reduction in scope 3. A year-on-year comparison is captured in a table followed by a breakdown of scope 3 emissions across categories.
GHG EMISSIONS YEAR-ON-YEAR (tCO2e)
| 2021 | 2022 | |
| SCOPE 1 | 11,144 | 11,828 |
| SCOPE 2 | 5,193 | 4,185 |
| SCOPE 3 | 1,073,391 | 1,052,603 |
| TOTAL | 1,089,728 | 1,068,617 |
GUCCI'S SCOPE 3 GHG EMISSIONS IN 2022 BY CATEGORY
DIRECT OPERATIONS 2022 IN NUMBERS
in accordance with RE100 guidelines
with a goal to certify 380 eligible
directly-operated stores by 2025
Building Management Systems and 50% by 2025
SUPPLY CHAIN 2022 IN NUMBERS