Minimizing Impacts
through Action
Powered by our EP&L and led by science, we’ve been focused on actions and opportunities to minimize the impacts across our value chain, starting from raw material production. Our reduction goals align with a 1.5°C pathway, with an additional target under our parent company Kering to decrease our absolute greenhouse gas emissions across scopes 1,2 and 3 of the GHG Protocol by -40% by 2035.
2023 SPOTLIGHT
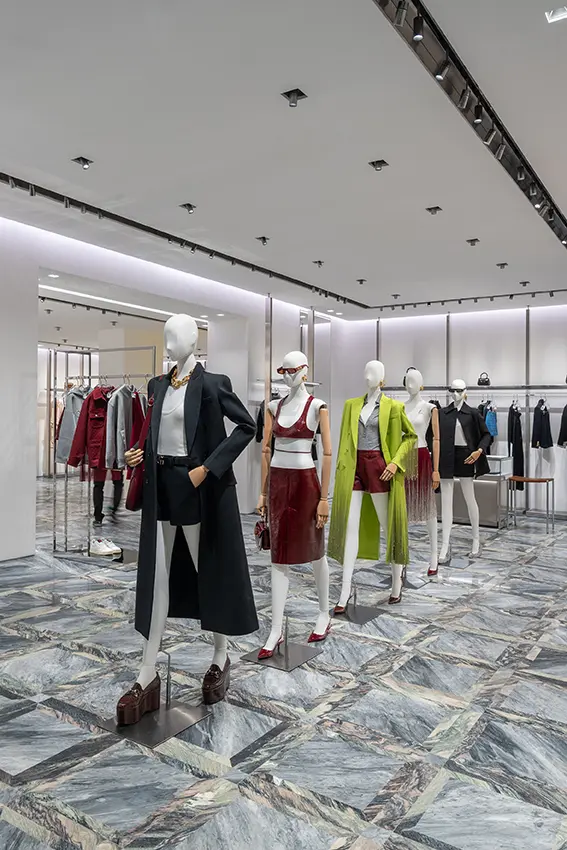
Gucci Store: NYC’s Meatpacking District

In March, we opened a new concept space in New York’s renowned Meatpacking District, celebrating the area’s eclecticism, vibrancy, and creative energy. The diverse elements in the store’s 70s-inspired interior design also celebrates our sustainability approach found across our retail network.
2023 impact reductions
We’ve been focused on adopting best practices, increasing
sustainable raw materials, embedding circular principles,
devising innovative solutions and gaining greater transparency
in order to reach our sustainability goals, making good progress
in 2023. For our new absolute target encompassing scopes 1,2 and
3 of the GHG Protocol, we attained a -7% absolute reduction in
GHG emissions overall, compared to a 2021 baseline.
Our other reduction targets are verified by the Science Based Target initiative (SBTi) under our parent company Kering. We achieved a -78% absolute reduction of GHG emissions in scopes 1 and 2 of the GHG Protocol and reduced our scope 3 emissions by -45% per unit of value, all from a 2015 baseline. As part of the science-based target, we also continued to maintain 100% renewable energy in accordance with the RE100’s guidelines after achieving this objective in 2022. A year-on-year comparison of our GHG emissions is outlined in a table, followed by a breakdown of absolute emissions across our tiers.
Absolute GHG Emissions Year-on-Year (tCO2e)
2021 EMISSIONS
Scope 1
11,084
Scope 2
5,193
Scope 3
1,285,766
Total
1,302,043
2022 EMISSIONS
Scope 1
11,829
Scope 2
4,185
Scope 3
1,412,871
Total
1,428,885
2023 EMISSIONS
Scope 1
7,083
Scope 2
3,869
Scope 3
1,196,154
Total
1,207,106
*Scopes 1,2 and 3 as defined by the GHG Protocol
**Scope 3 data in 2021 and 2022 increased compared to this data
in the 2022 Gucci Equilibrium Impact Report due to changes in
methodology, which is also reflected in the total GHG emissions
increase for both years.
Key takeaways
Scopes 1 and 2 represented 1% of our absolute GHG emissions in 2023 and were reduced by -32% from 2022. Scope 3 absolute GHG emissions, which represented 99% of our absolute GHG emissions, dropped by -15% in 2023 compared to 2022. Overall we achieved a -16% absolute reduction across all scopes year-on-year.
Absolute GHG Emissions by Tier (tCO2e)
900239
End of Life
* Transversal operations not directly related to products and value chain (for example capital expenditures, franchises and financial investments, business travel and employee commuting, company cars and purchase of services, media activities)
Key Takeaways
Our direction operations (stores, offices and warehouses) in Tier 0 generated 10% of our absolute GHG emissions in 2023, while Tiers 1- 4 covering manufacturing and raw material production was responsible for 55% of our absolute GHG emissions, with raw material production generating 41% of our absolute GHG emissions.
2023 EP&L Results
Our annual Environmental Profit and Loss (EP&L) account
measures our impacts along the entire supply chain, covering
GHG emissions, water and air pollution, water consumption,
waste, and land use. It also captures consumer use and product
end of life. The analysis provides the necessary transparency
and understanding we need to effectively focus in on our
reduction efforts.
|
Use phase & End of Life
|
Tier 0
|
Tier 1
|
Tier 2
|
Tier 3
|
Tier 4
|
||
|
12%
|
6%
|
3%
|
4%
|
8%
|
67%
|
||
|
Air emissions
|
8%
|
|
|
|
|
|
|
|
GHGs Emissions
|
37%
|
|
|
|
|
|
|
|
Land use
|
32%
|
|
|
|
|
|
|
|
Waste
|
3%
|
|
|
|
|
|
|
|
Water Consumption
|
4%
|
|
|
|
|
|
|
|
Water Pollution
|
15%
|
|
|
|
|
|
|
Key Takeaways
Our overall environmental impact in 2023 decreased by -11% in comparison to 2022, while our EP&L intensity continued to decrease by -53% compared to a 2015 baseline. GHG emissions and land use continues to be our most impactful environmental indicators representing 69% of Gucci’s 2023 EP&L impact combined, while the value chain (Tiers 1 to 4) accounts for 82% of our footprint.
2023 Direct Operations
-
Renewable energy worldwide
100 %in accordance with the RE100’s guidelines -
LEED-certified sites
147 -
LED lighting in stores worldwide
90 % -
Building Management Systems in stores
100
2023 Supply Chain

-
Manufacturers based in Italy
95 % -
Supplier audits
2,506 -
Million EUR in loans
€734 Mvia Sviluppo Filiere program for suppliers since launching in 2020